Personal Projects and Data Visualizations
I spent a few years deep in data visualization, both professionally and on my own — as an engineer at a startup, in D3 and Processing, through animation work on YouTube, and in public projects shared on r/dataisbeautiful. This page collects that public body of work. I also have a set of D3 and Processing skills files for coding agents; reach out if you're curious.
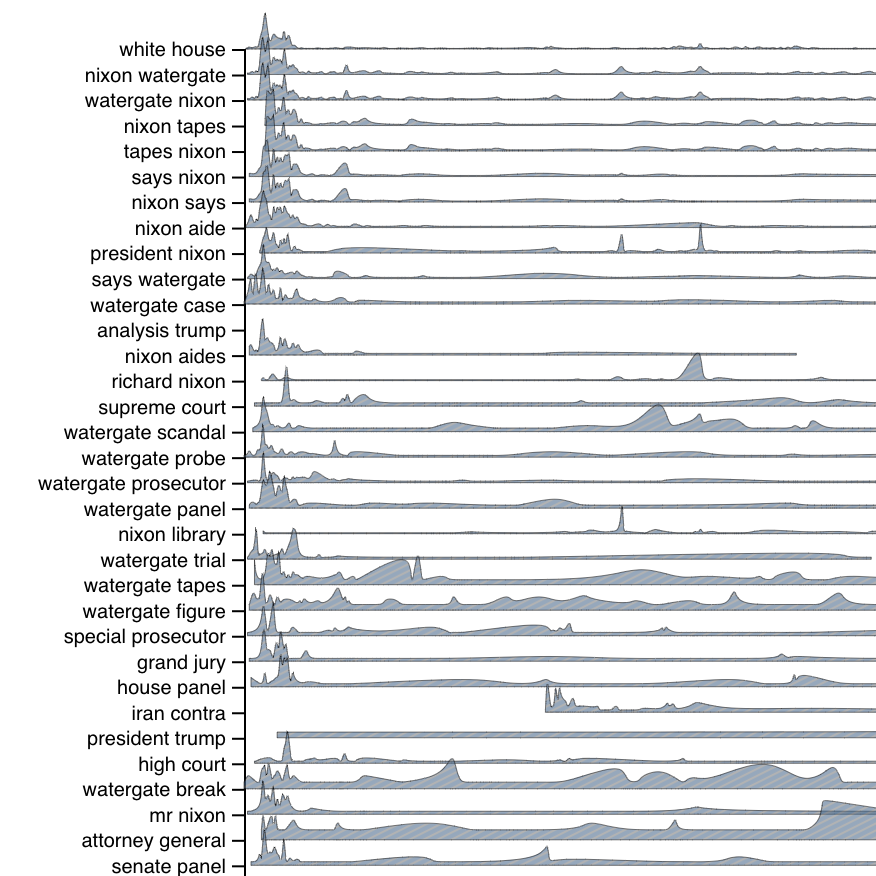
- The language of Watergate
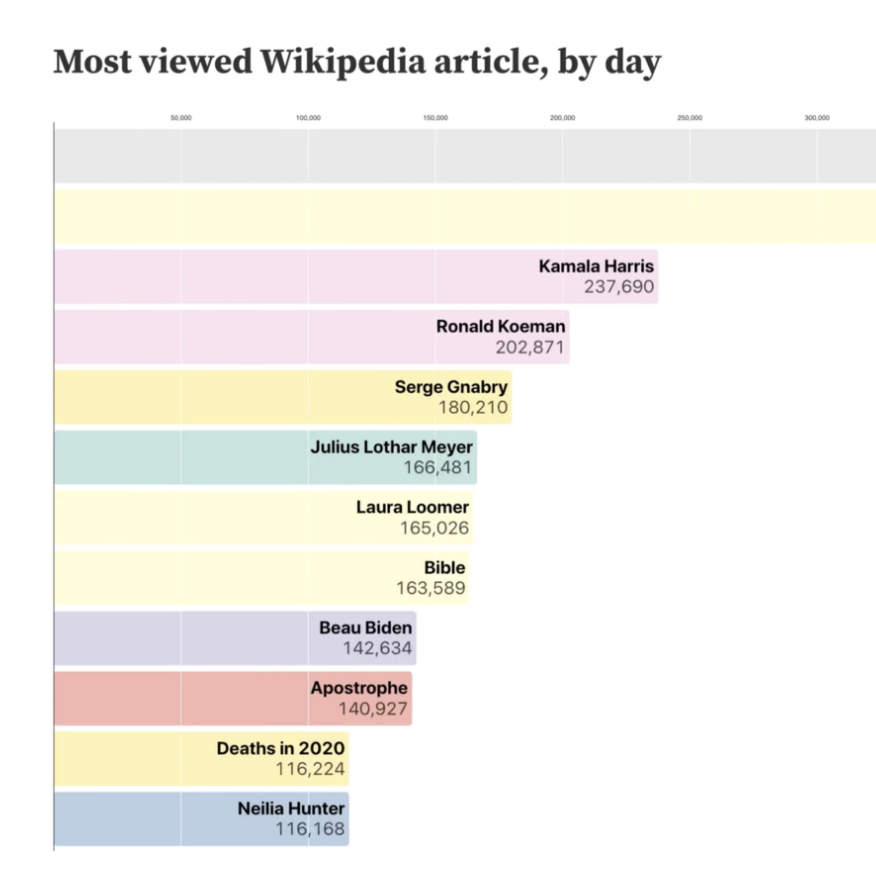
- Wikipedia Rewind
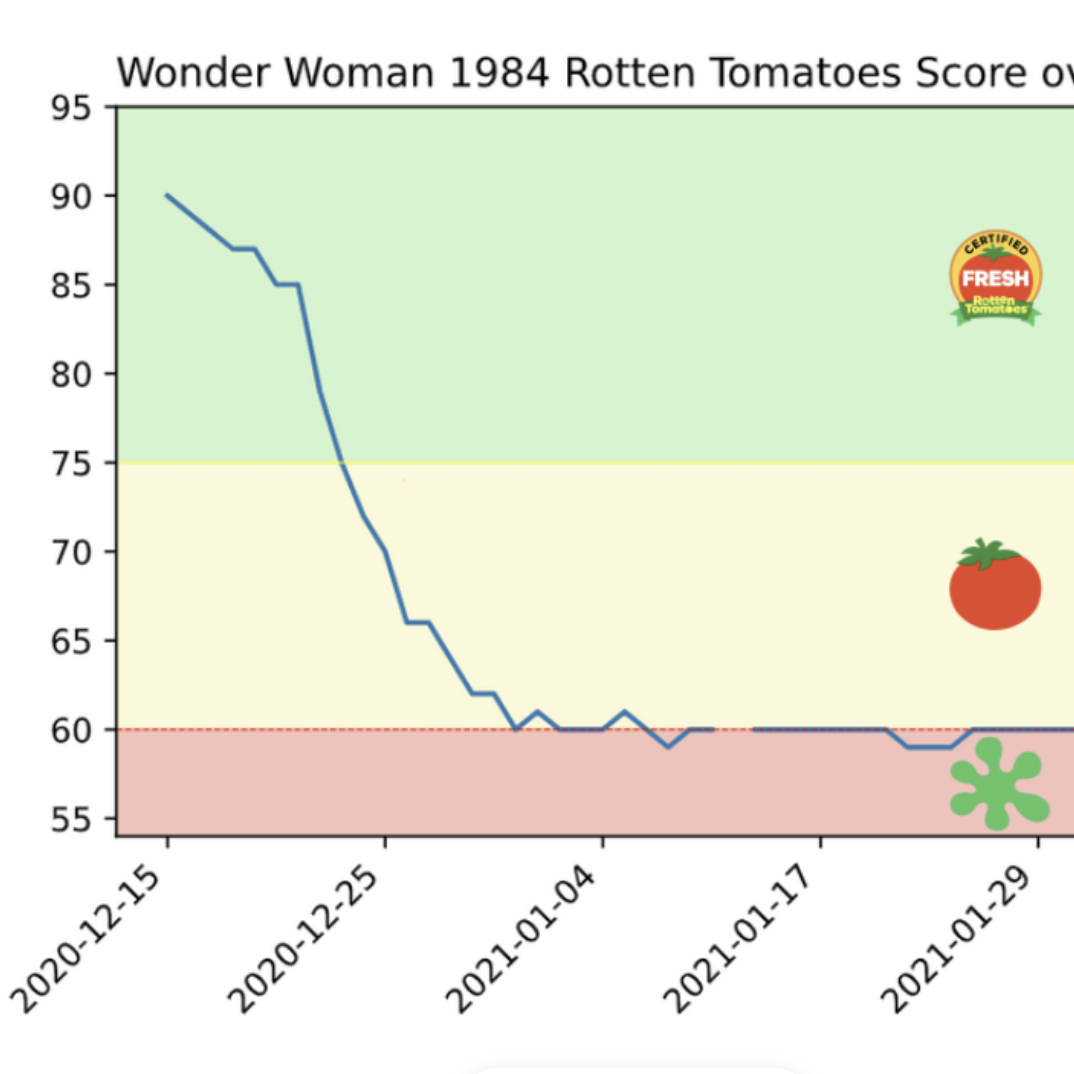
- Rotten Tomatoes Historical Analysis
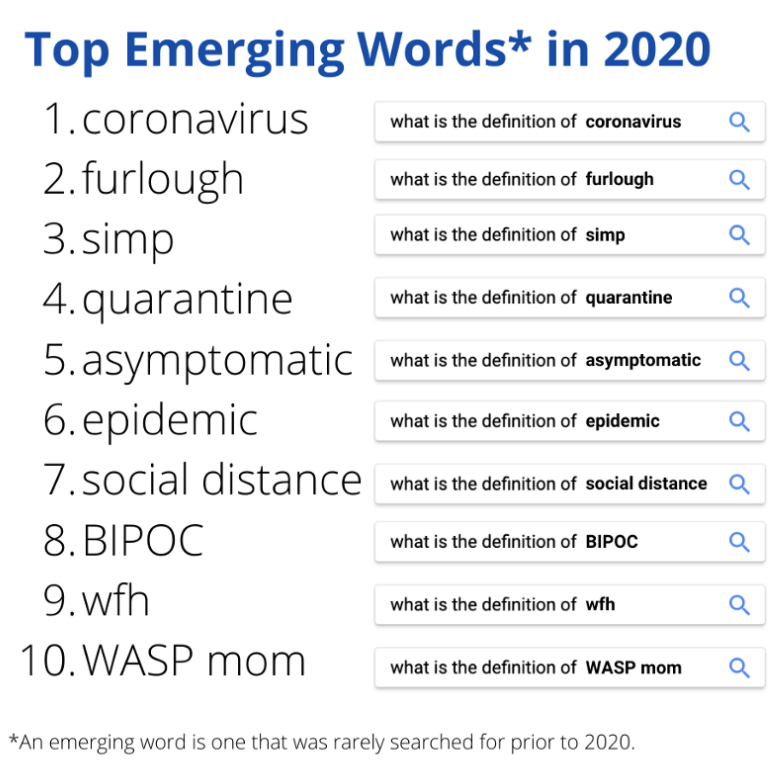
- 2020 Slang
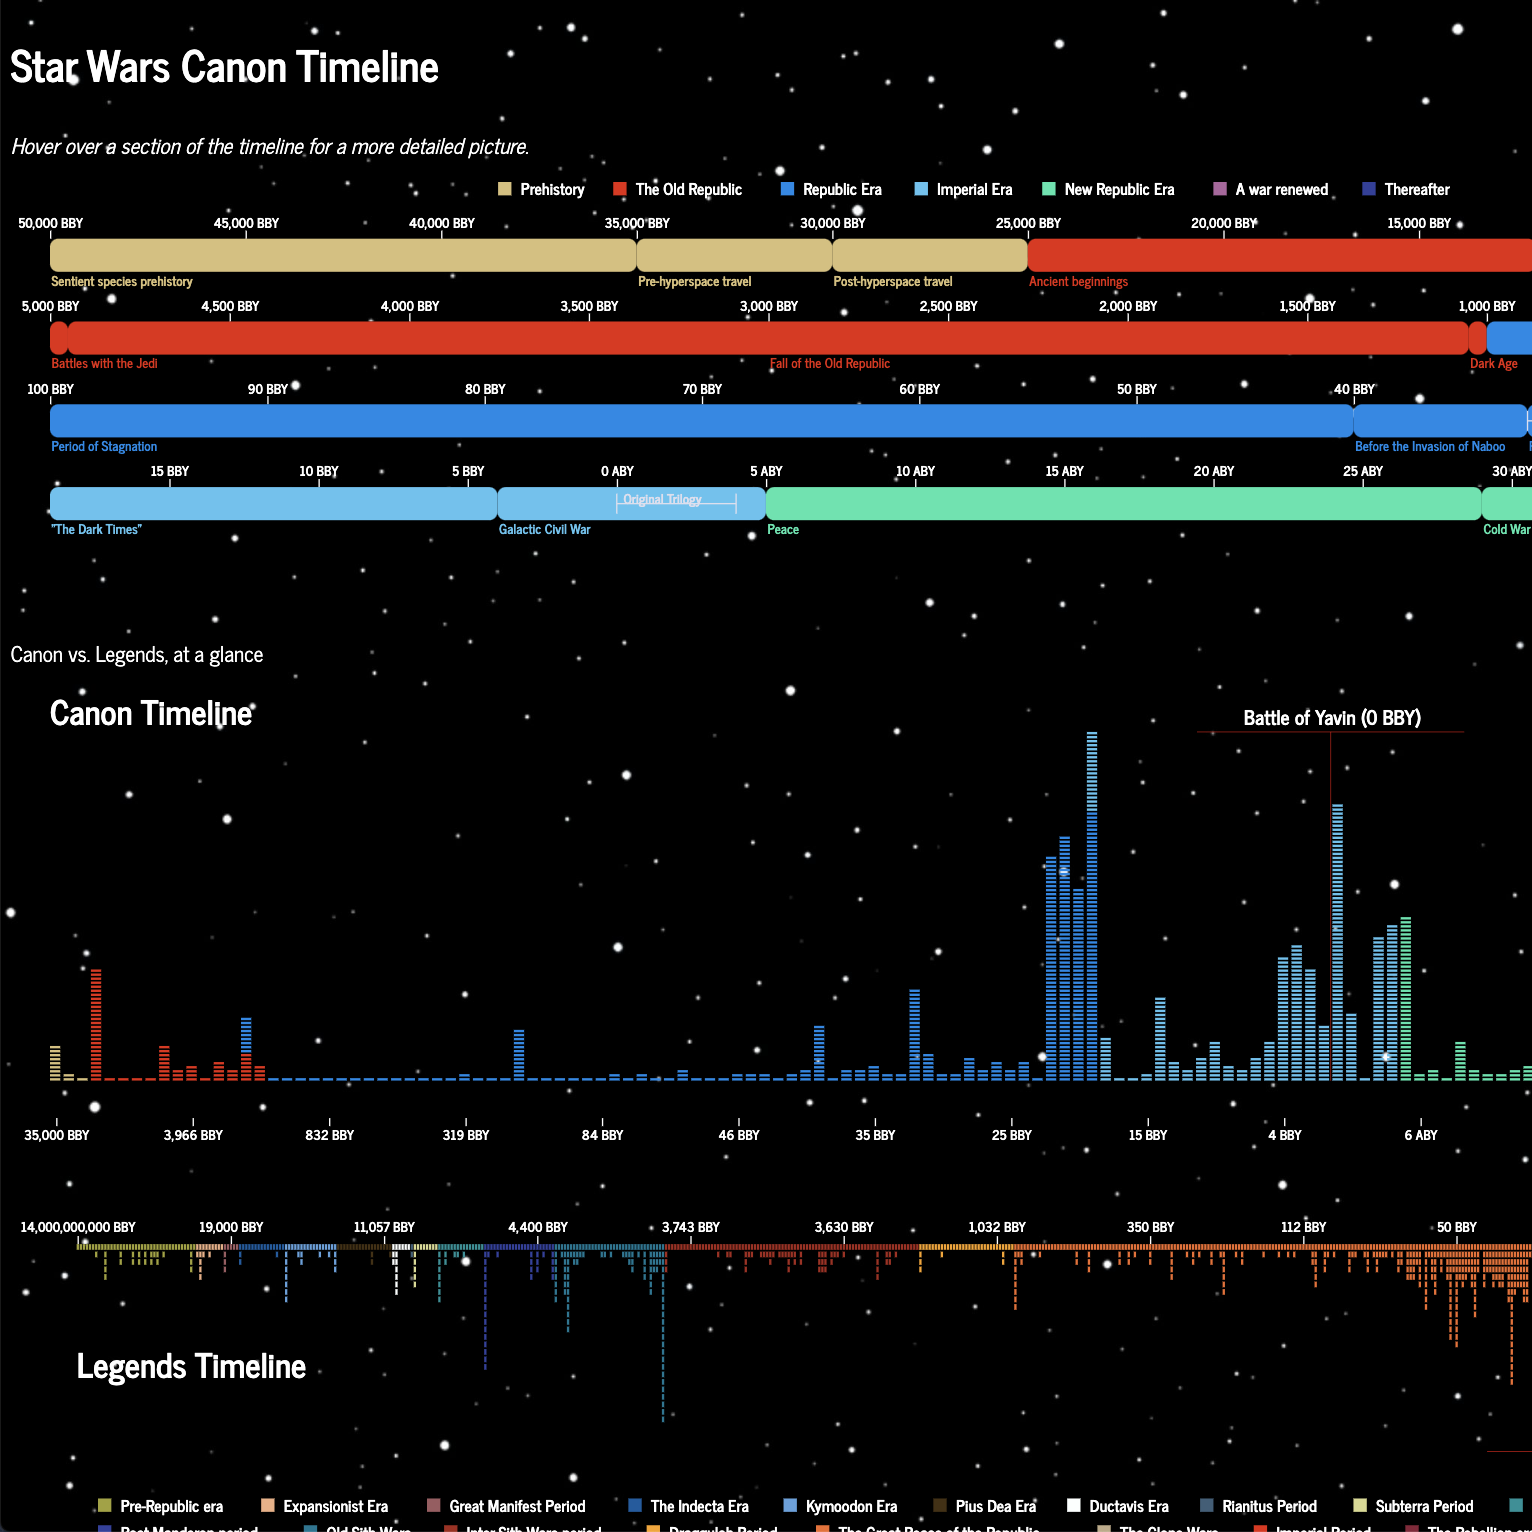
- Star Wars Timeline
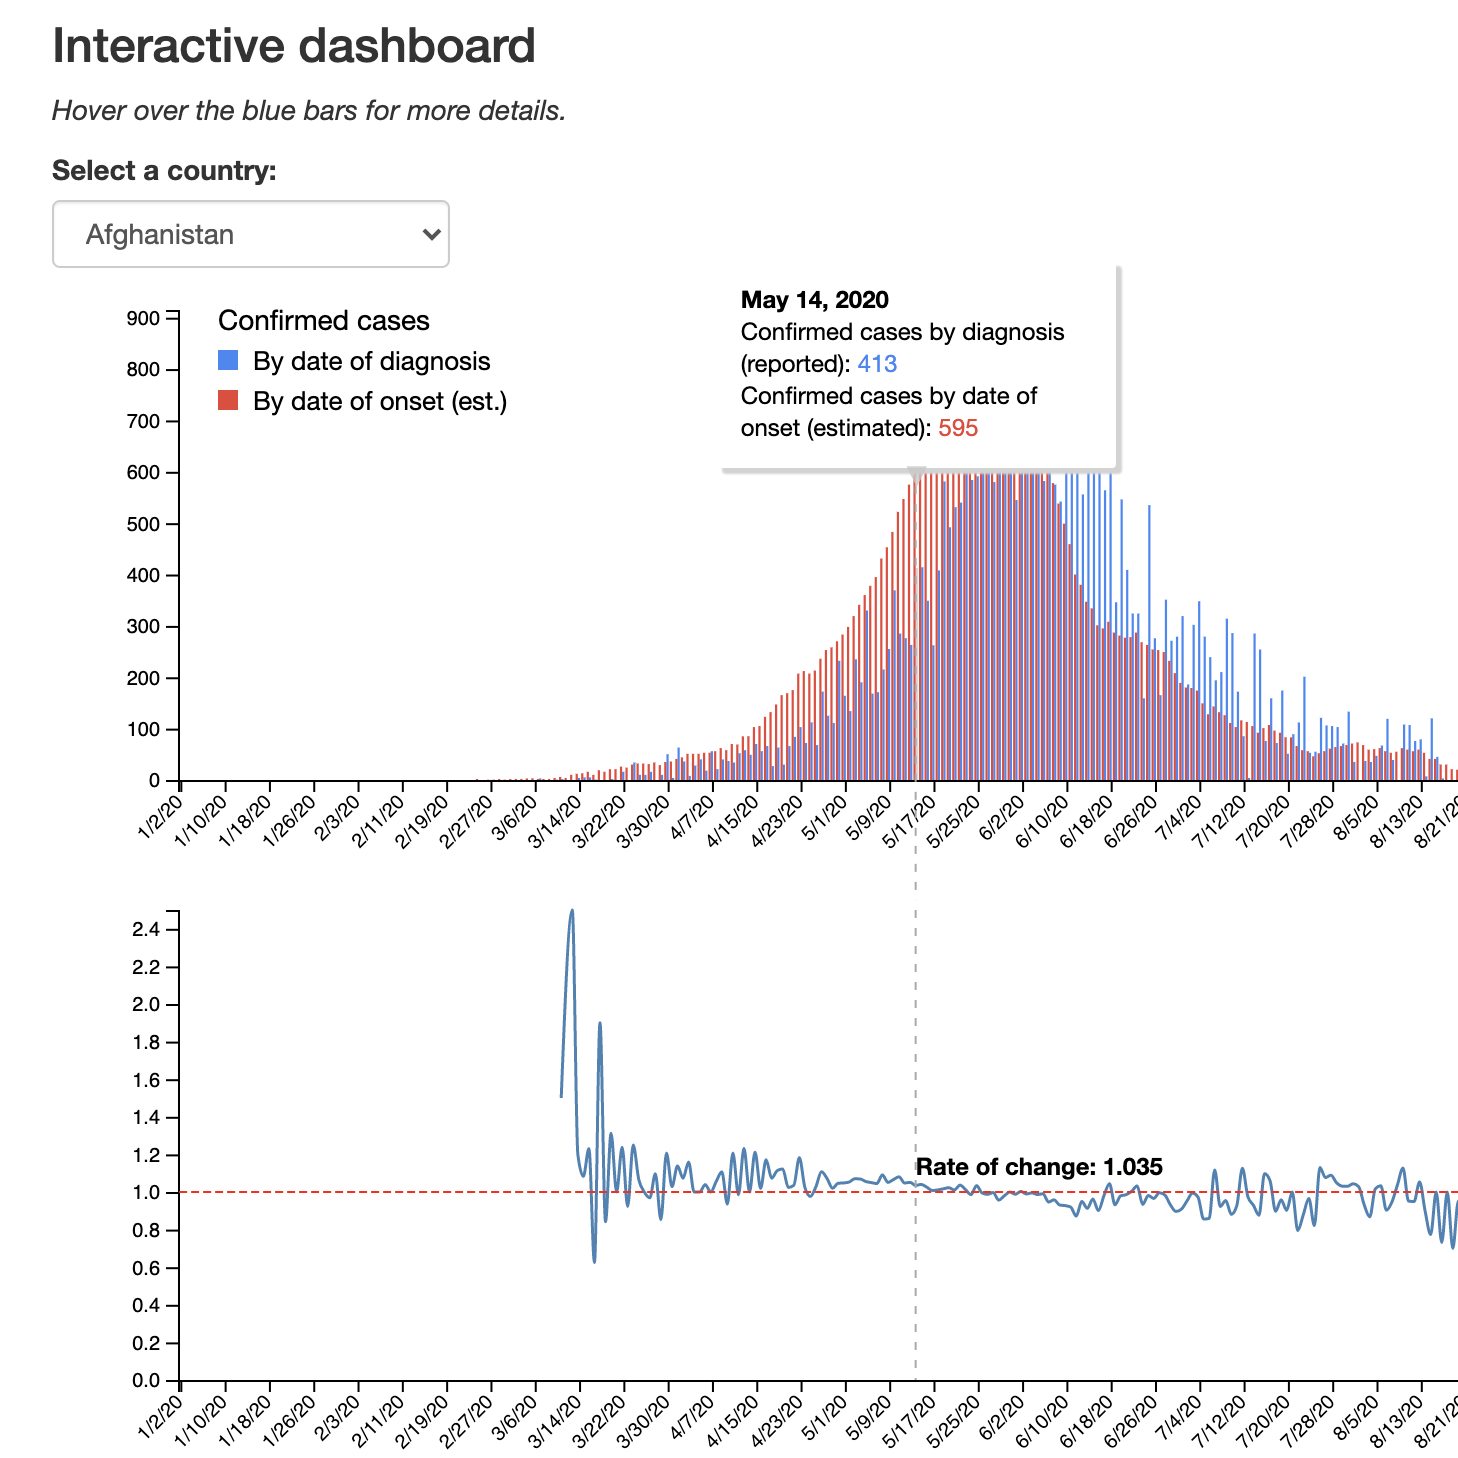
- Modeling the Coronavirus
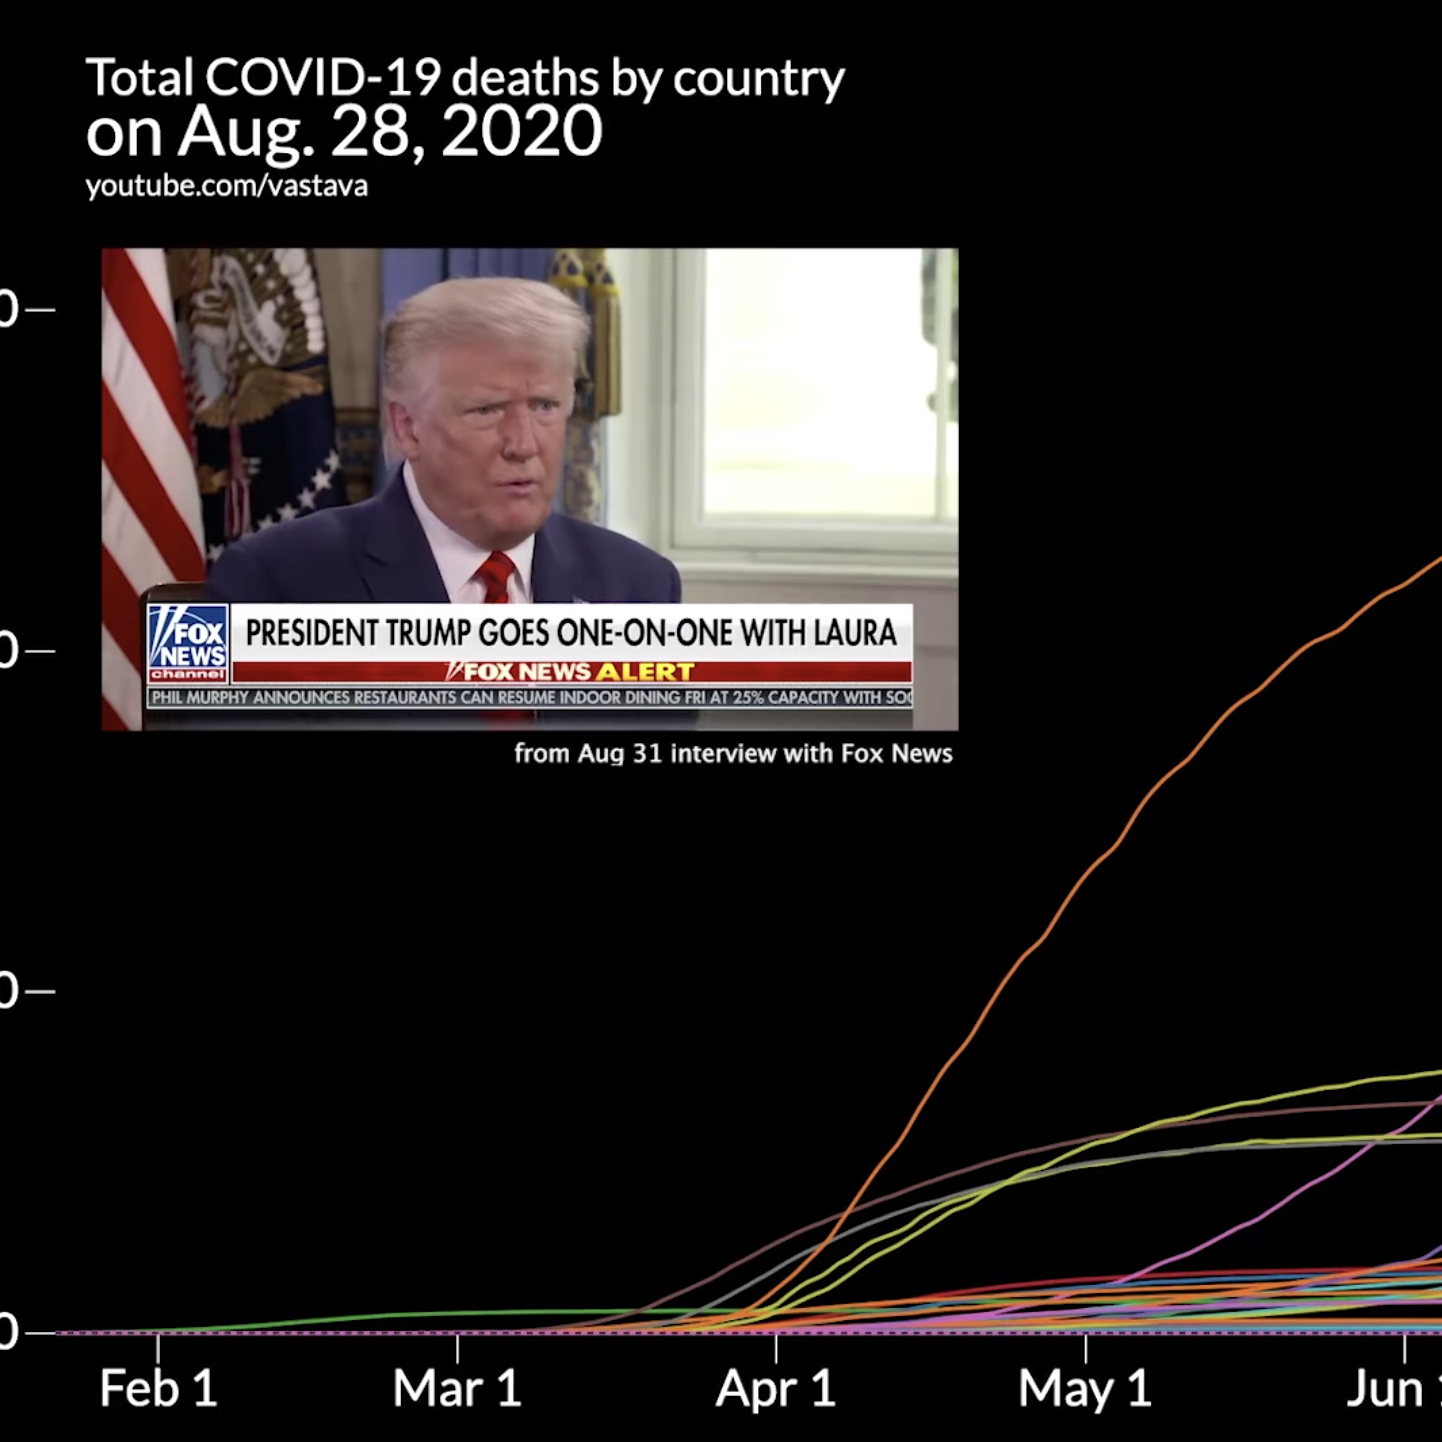
- COVID-19 Timeline
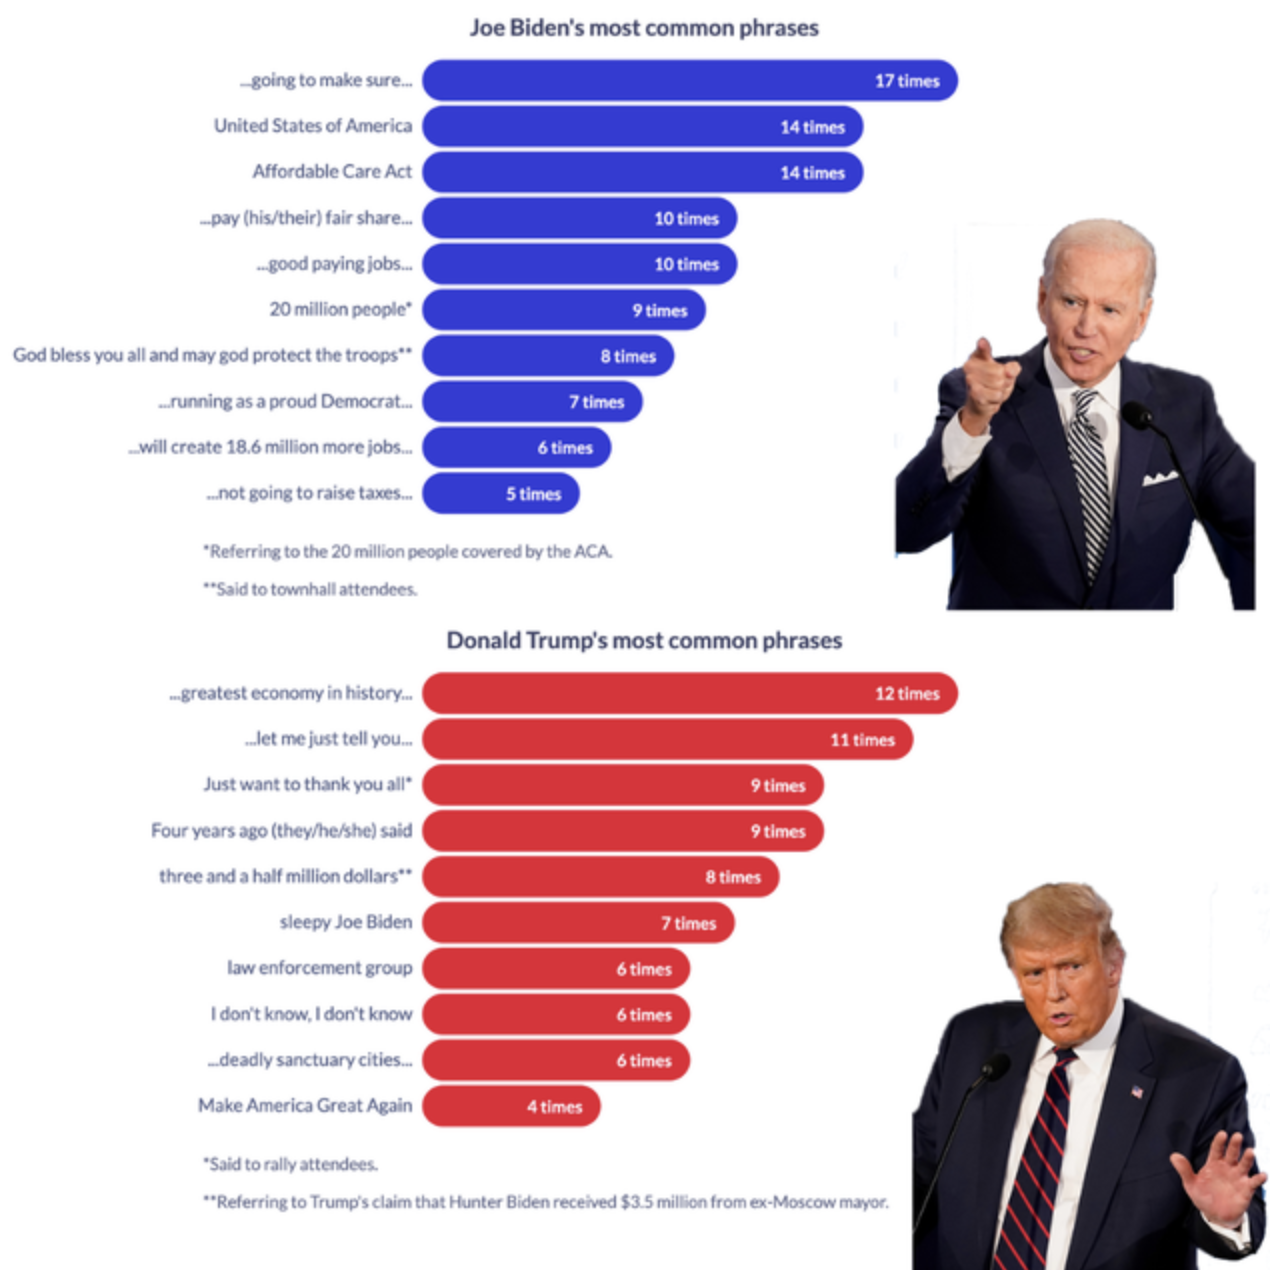
- The Debate Drinking Game
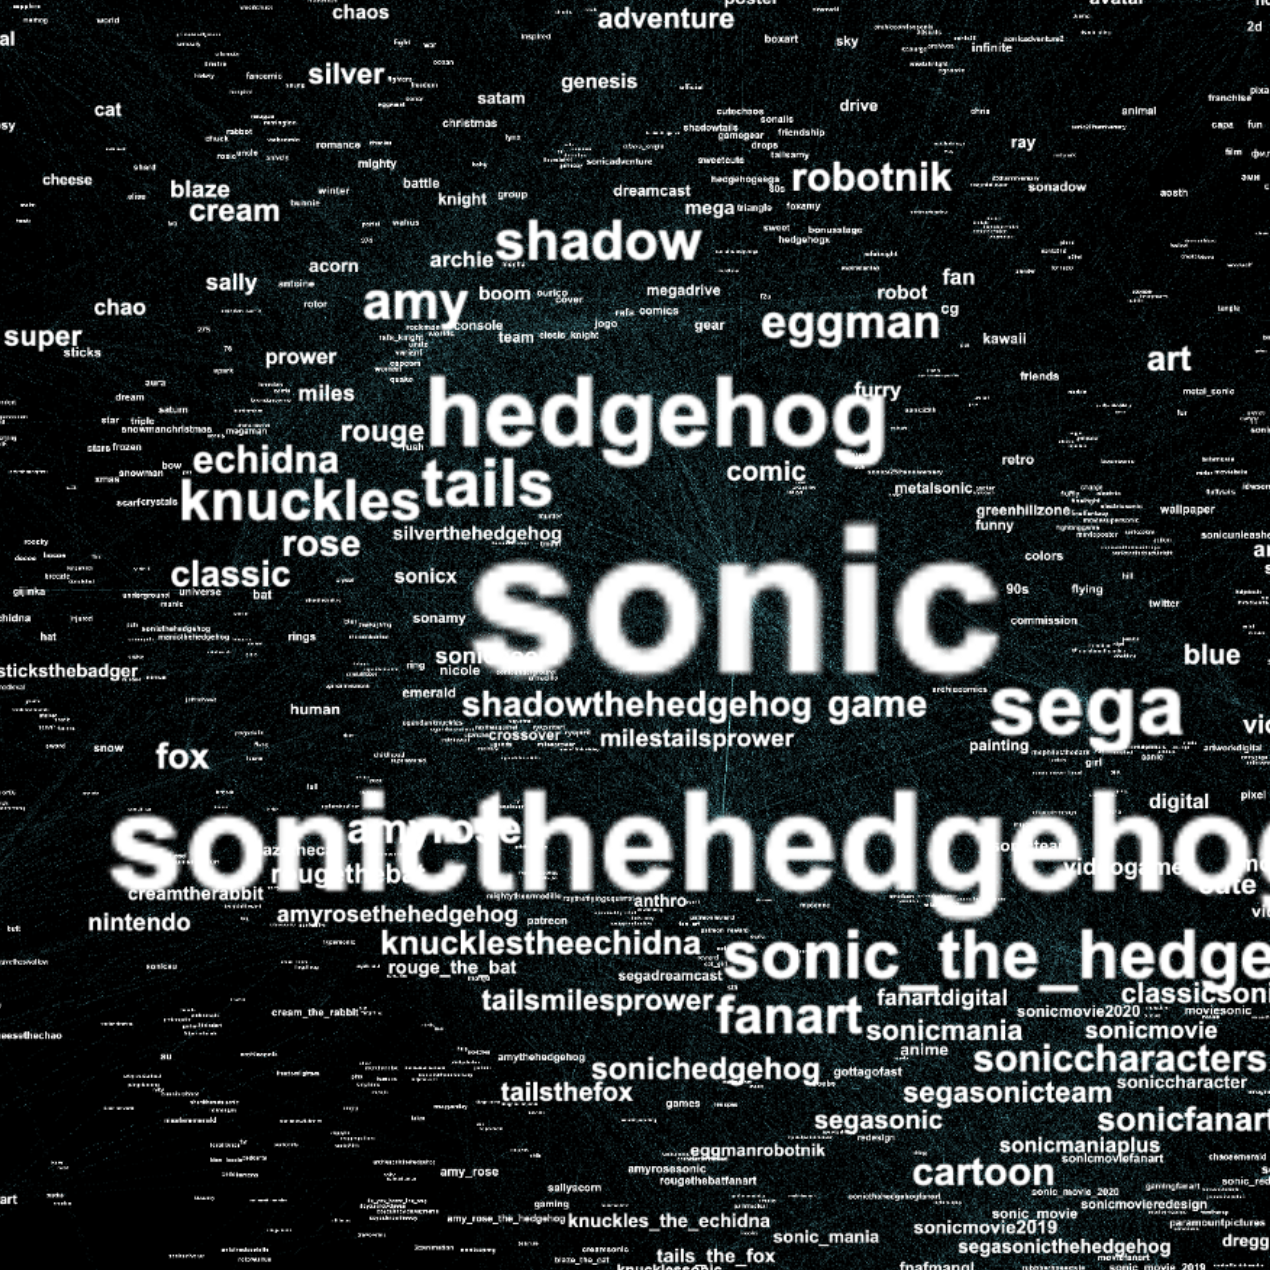
- Analyzing Sonic Fan Art
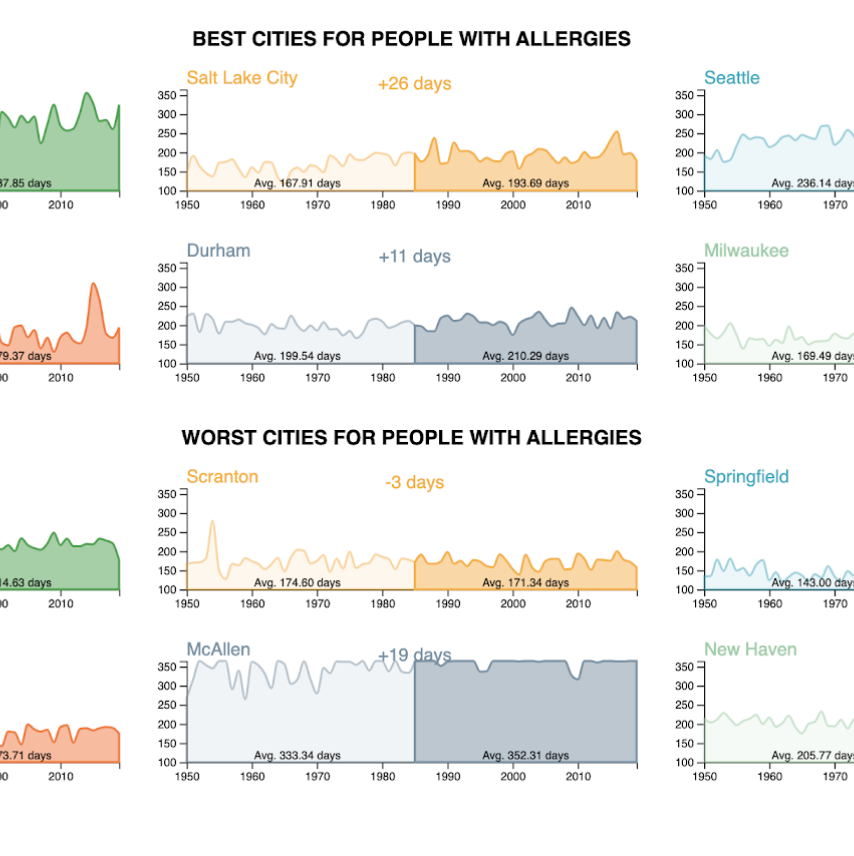
- Allergies and climate change analysis
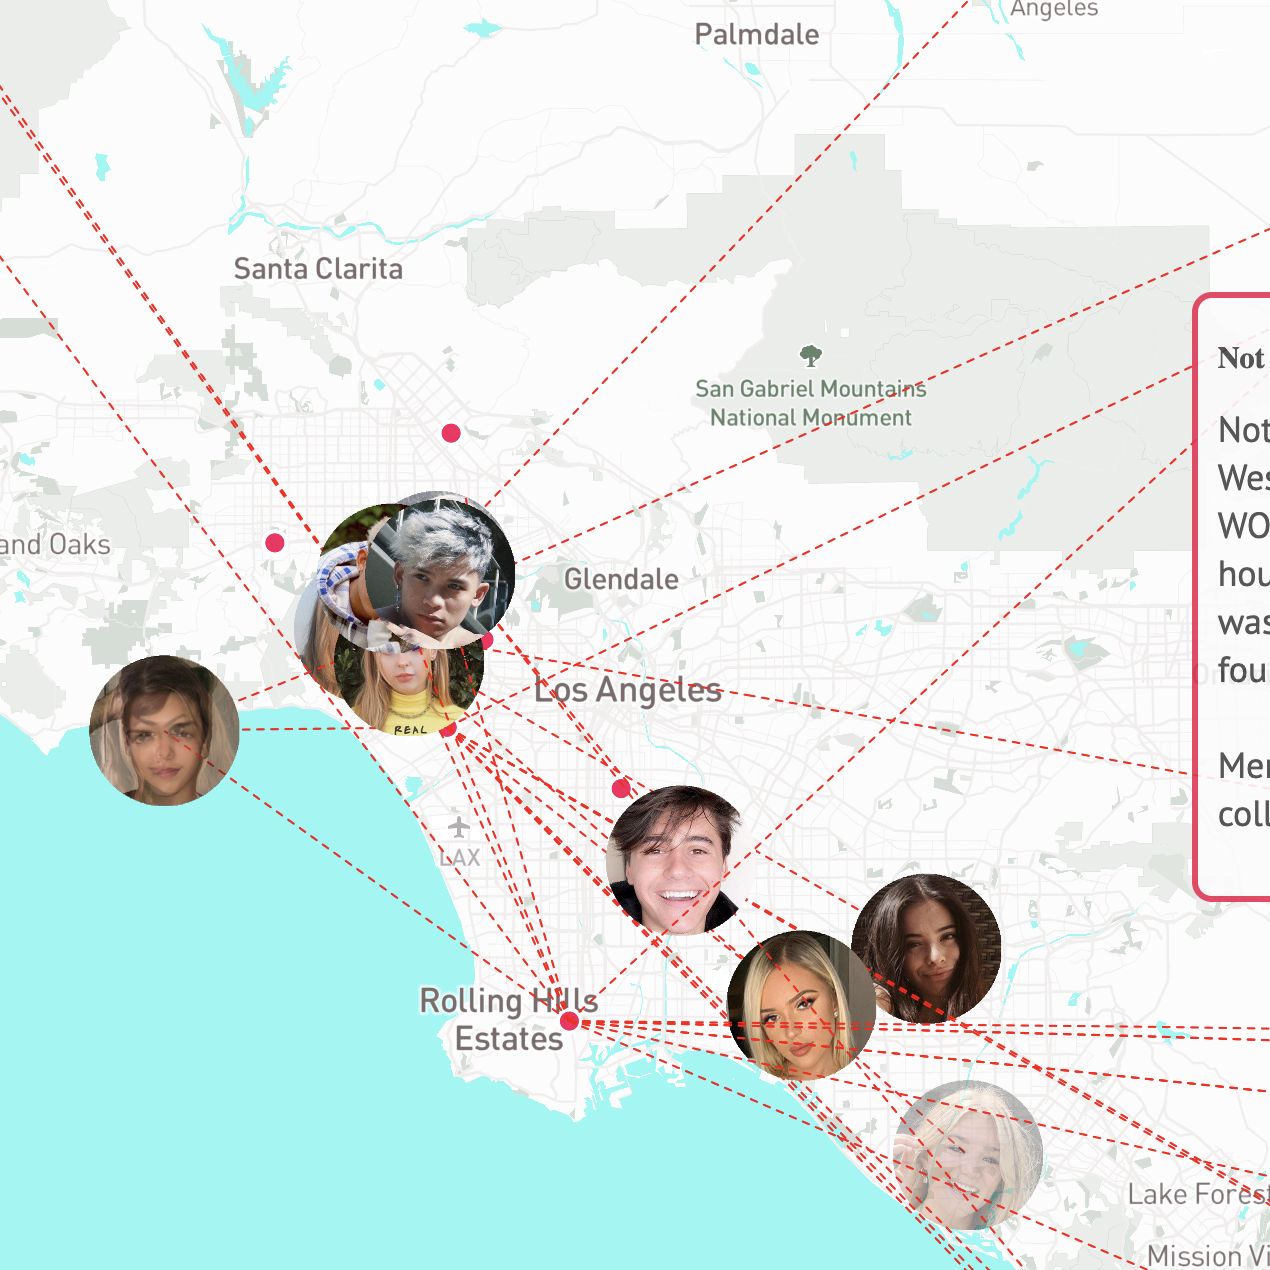
- Mapping TikTok Mansions
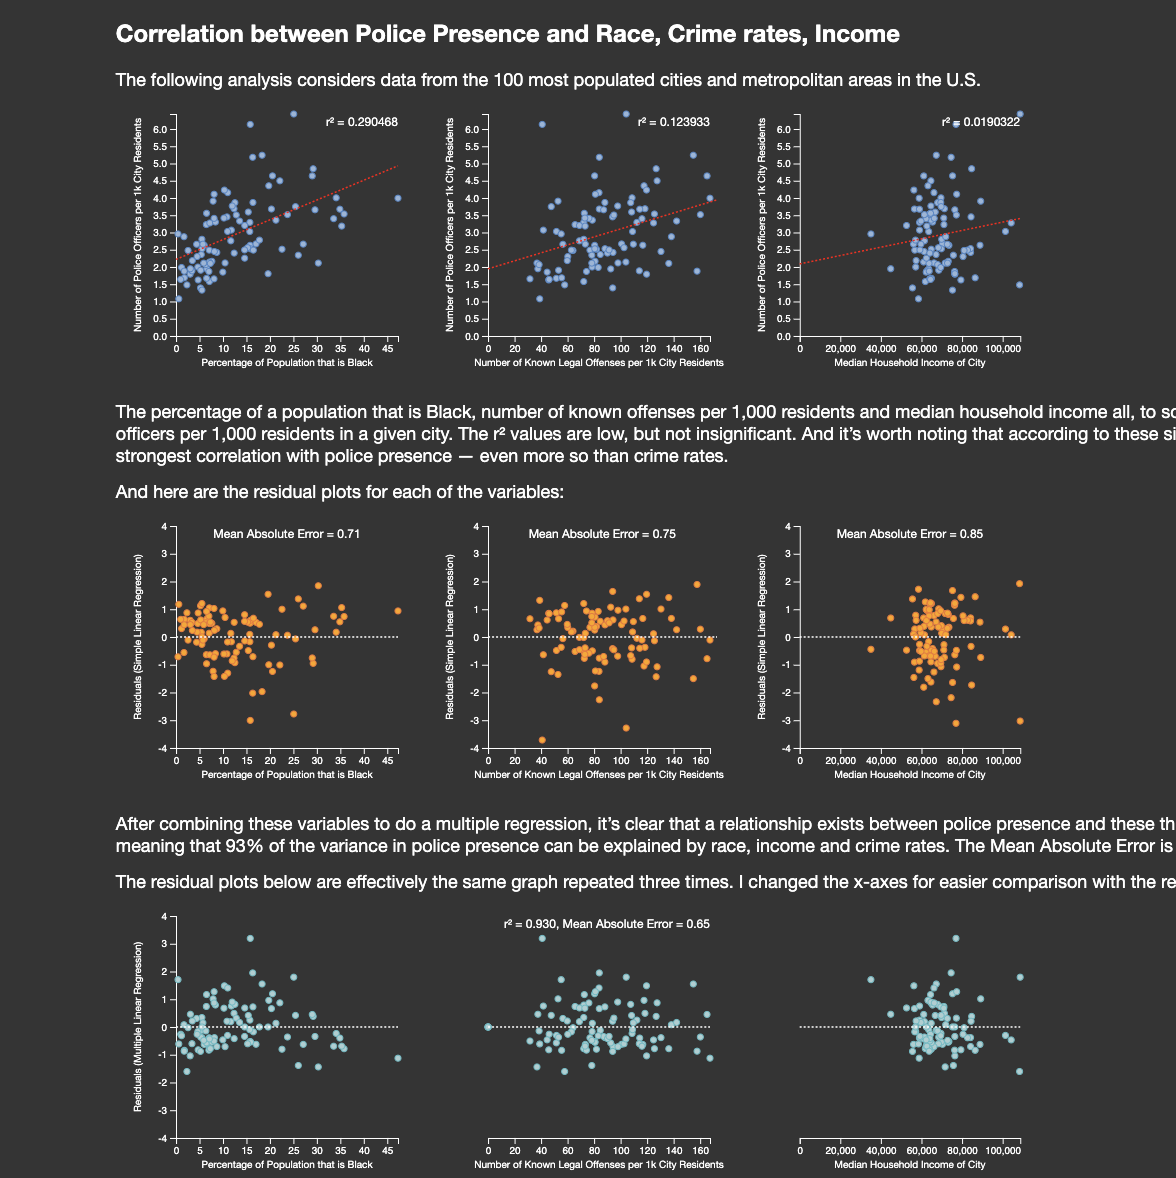
- Analyzing police presence
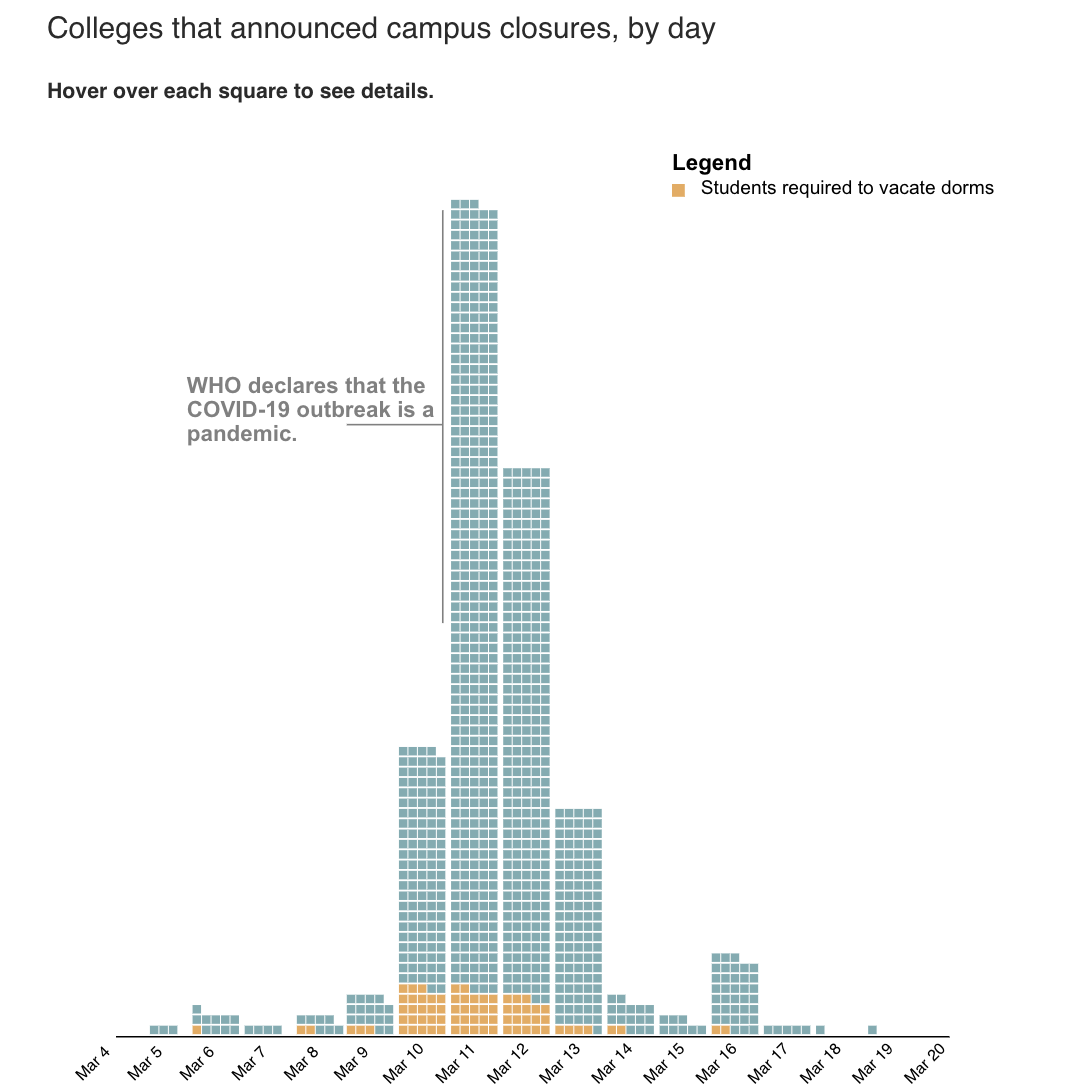
- COVID-19 College Closures
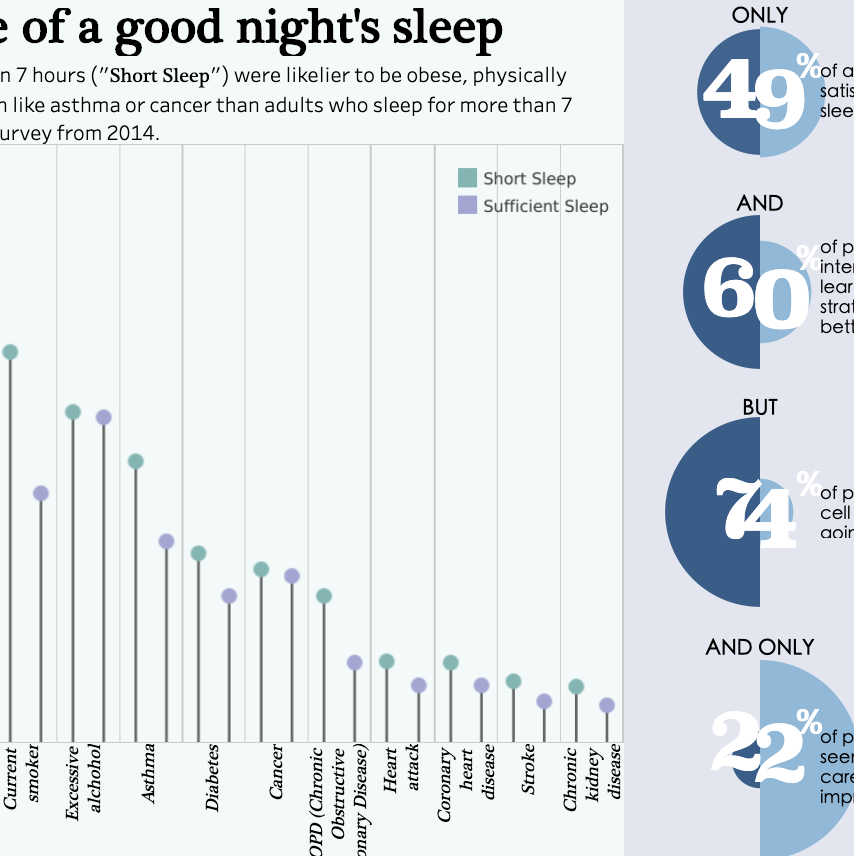
- Sleep and wellness
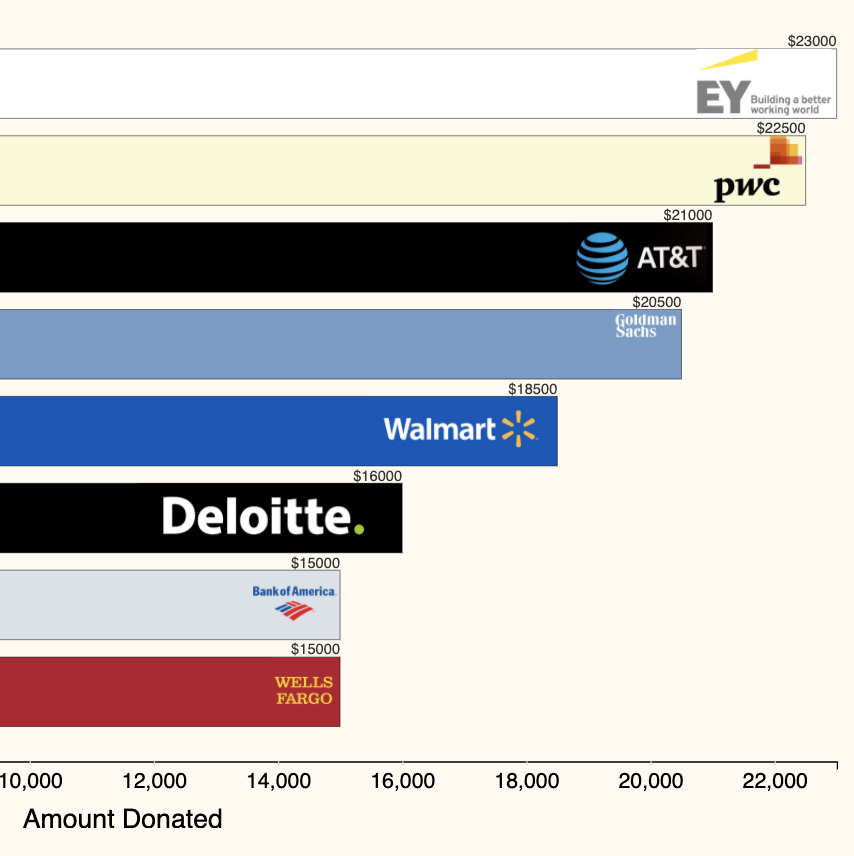
- Sen Cotton's biggest donors
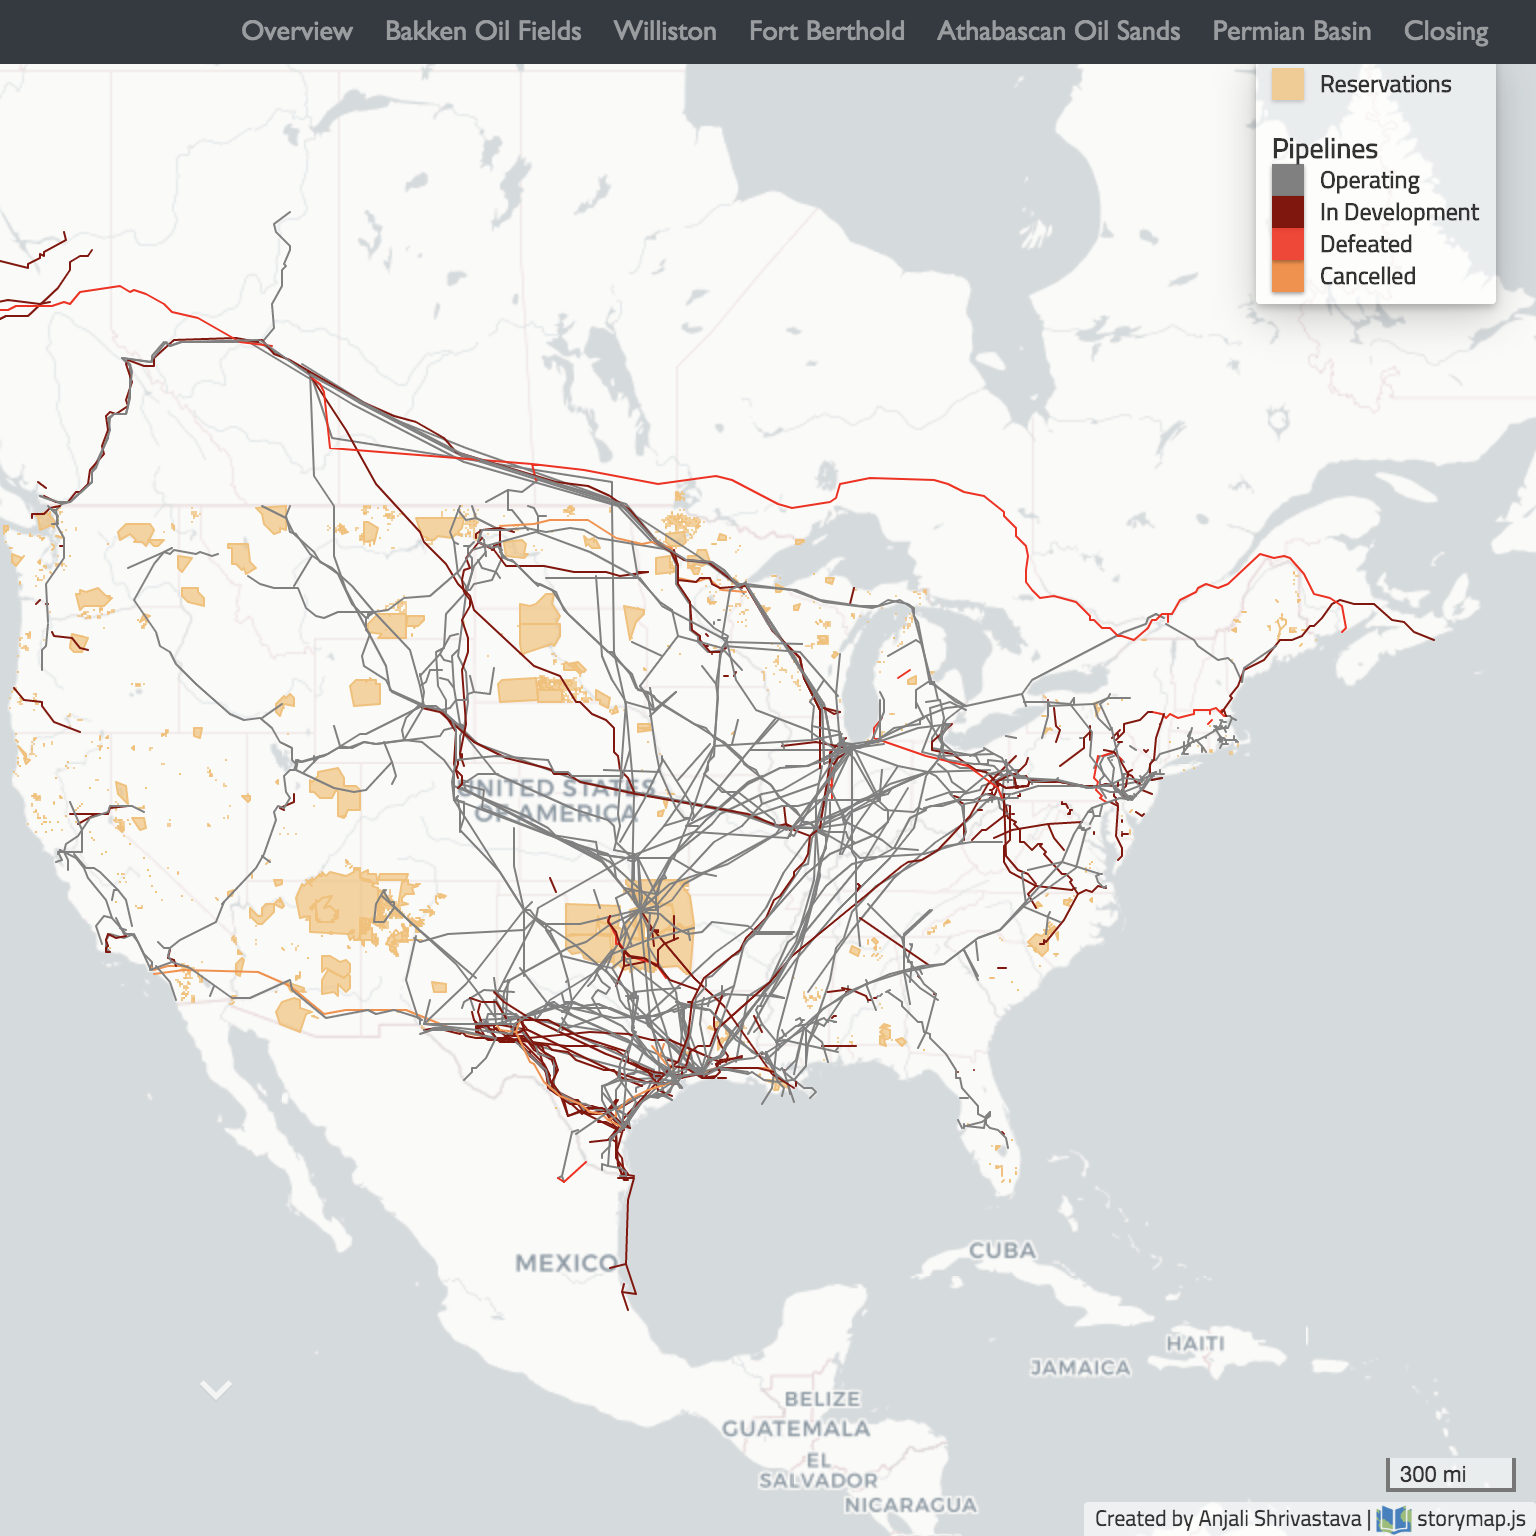
- Pipeline Map

- Netflix and the Oscars
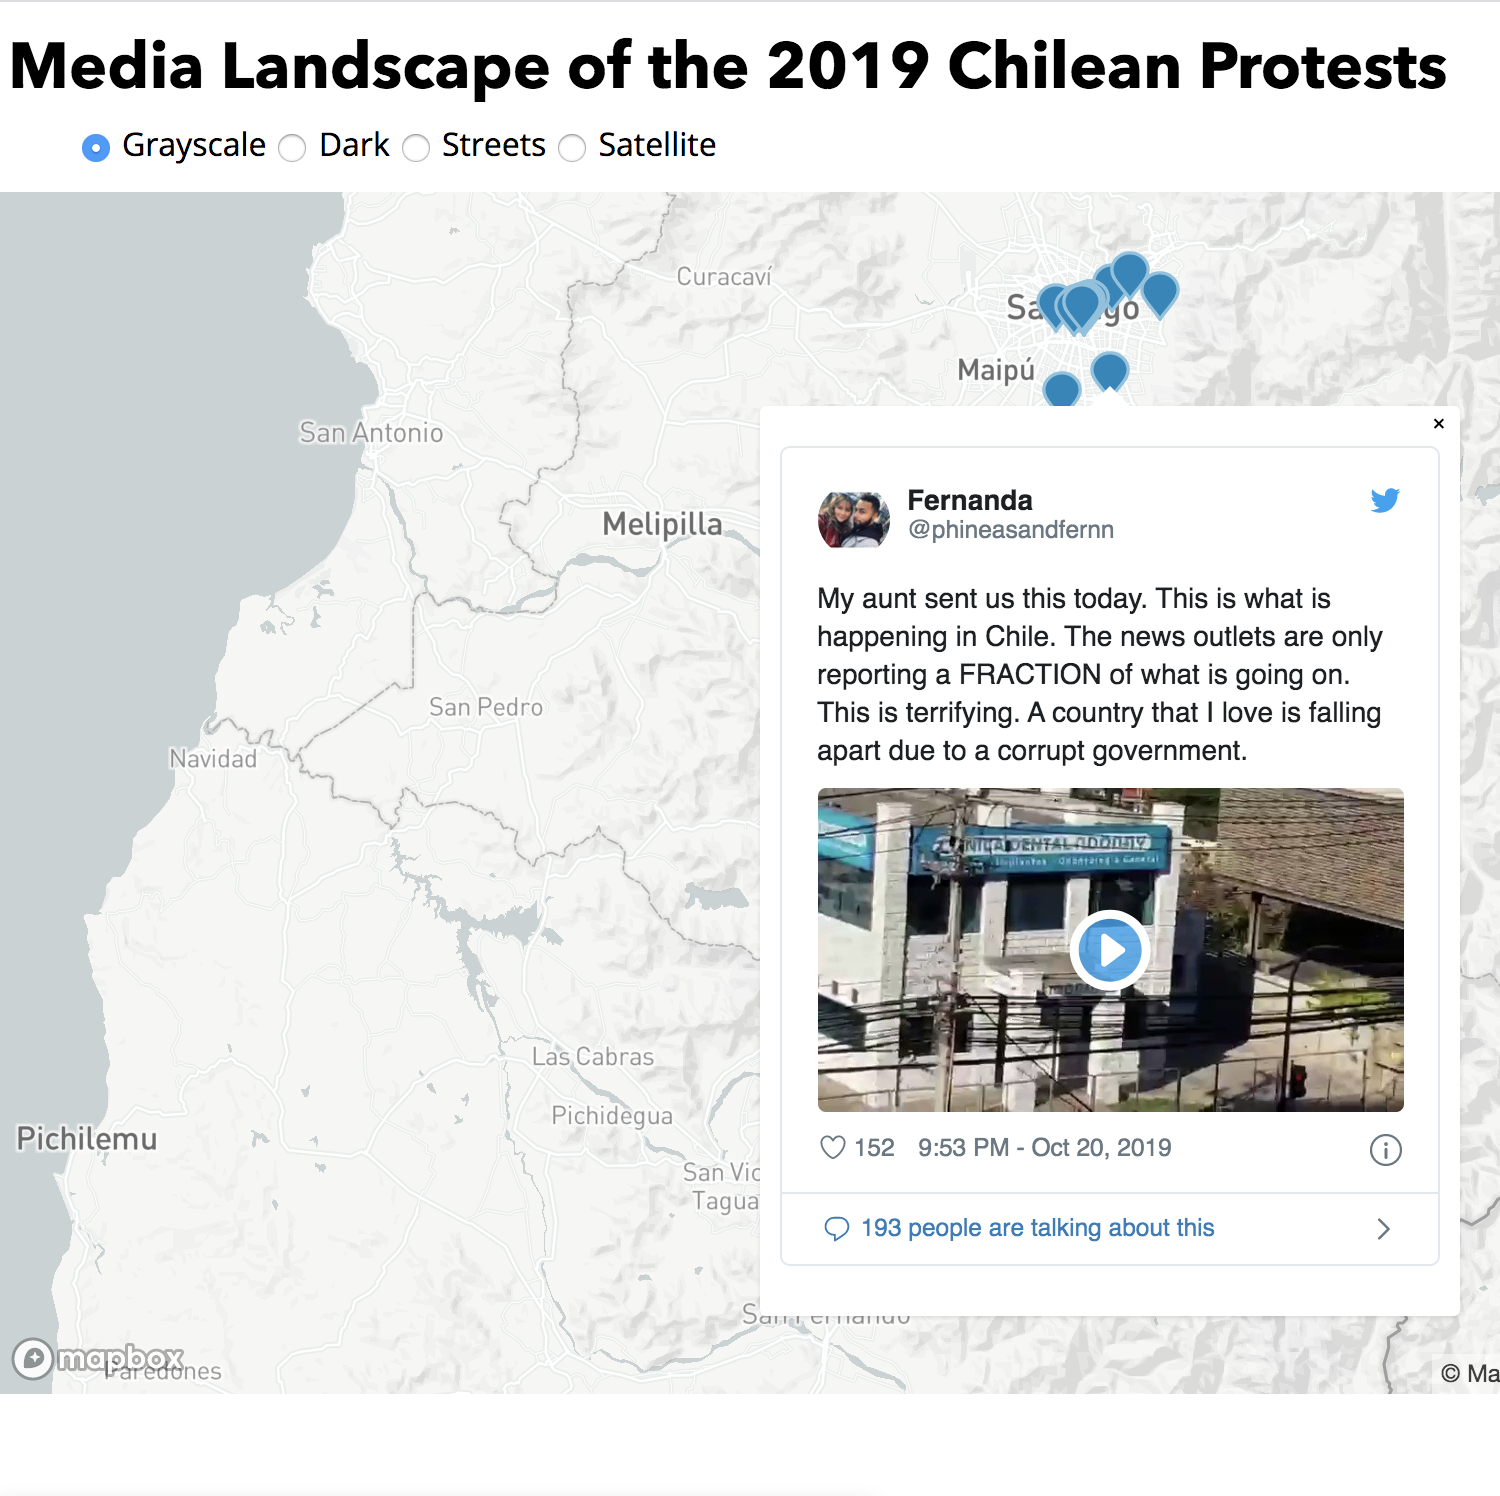
- Chile Protests Map
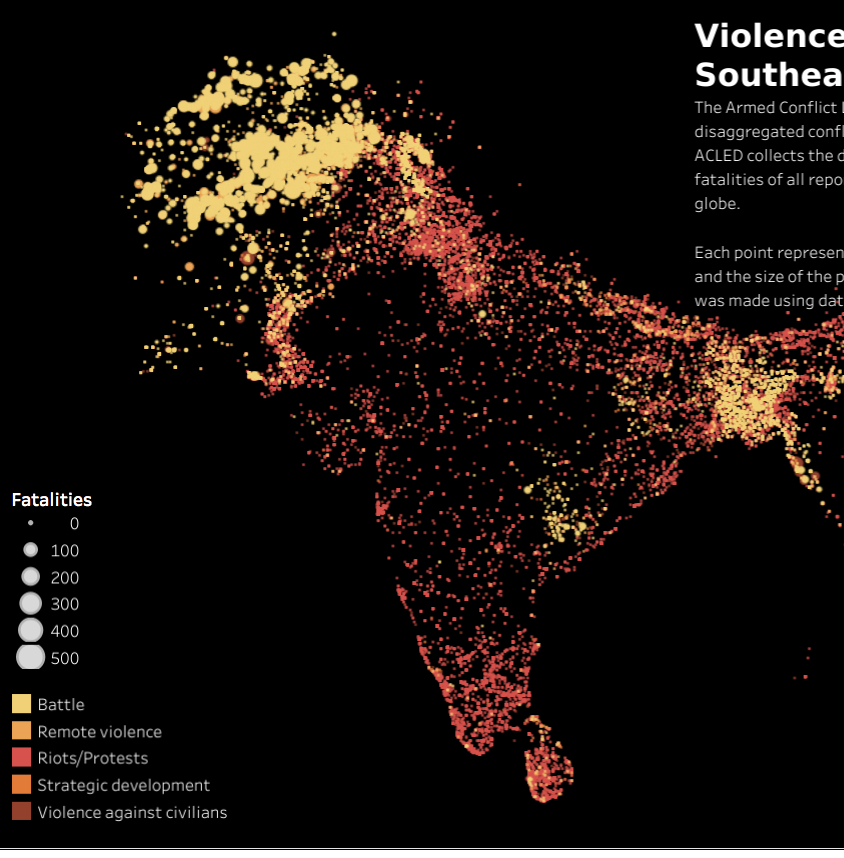
- Violence in South and Southeast Asia
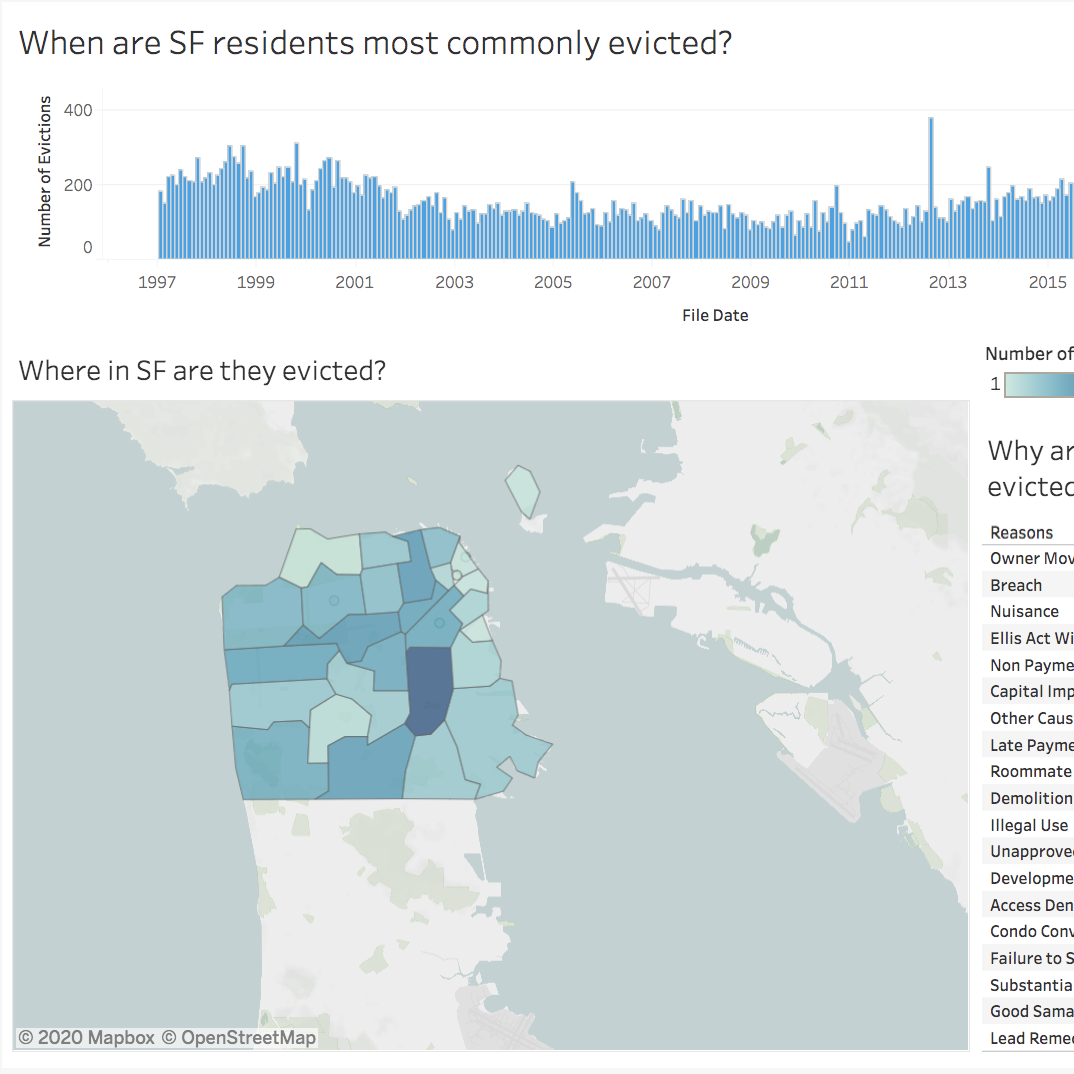
- SF Evictions
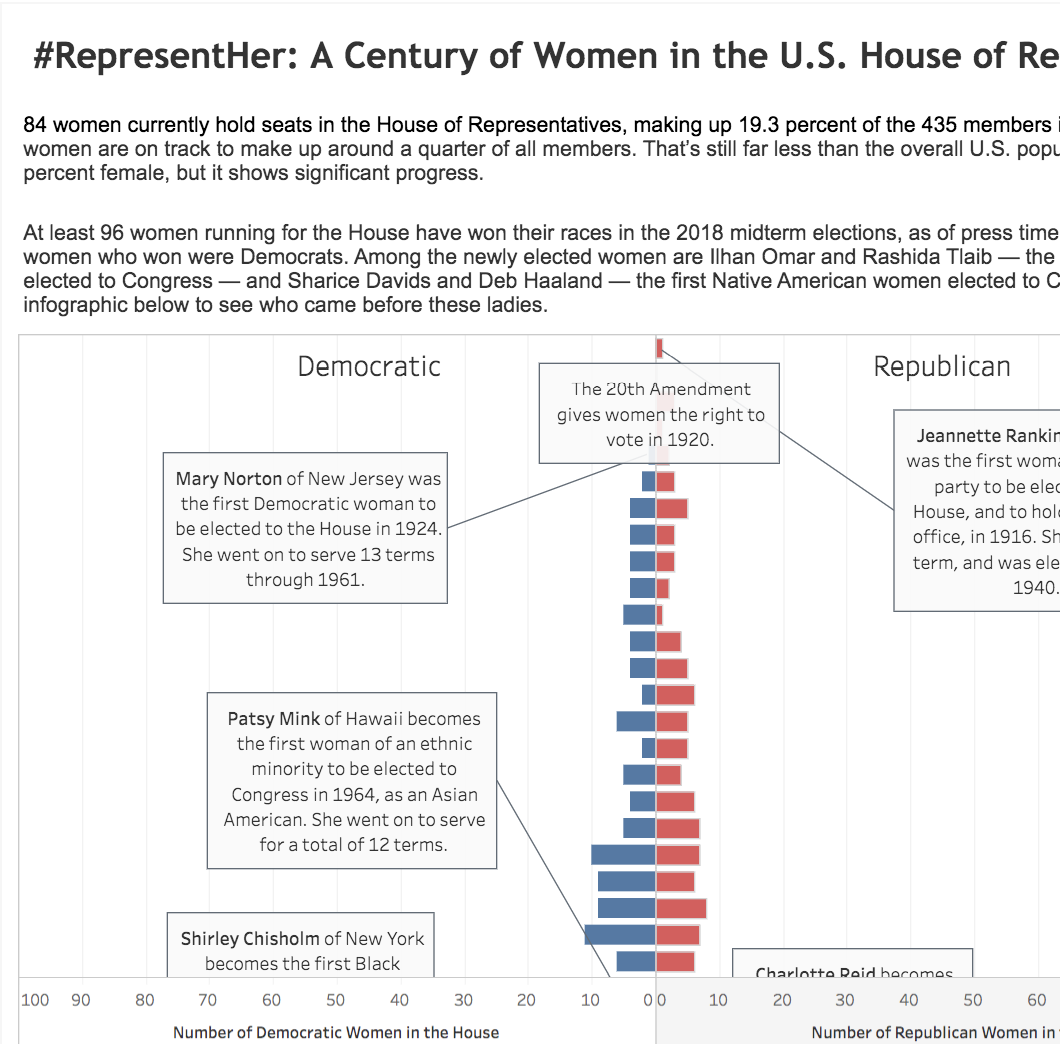
- Women in Congress
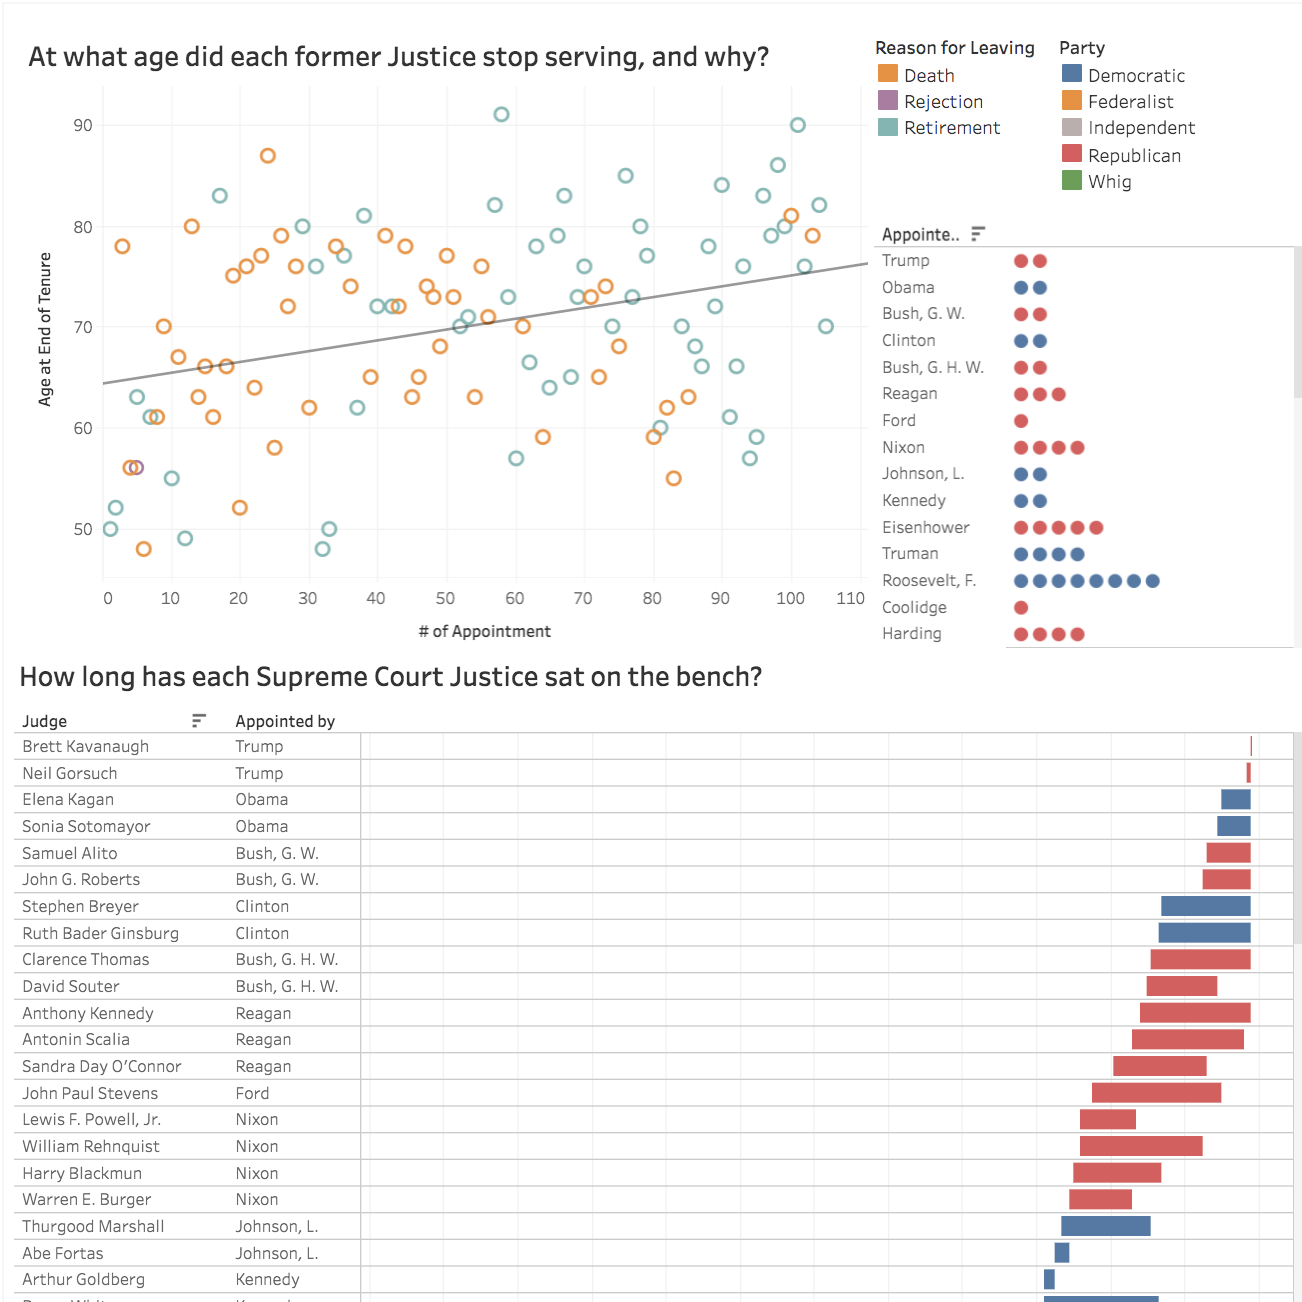
- Supreme Court Dashboard
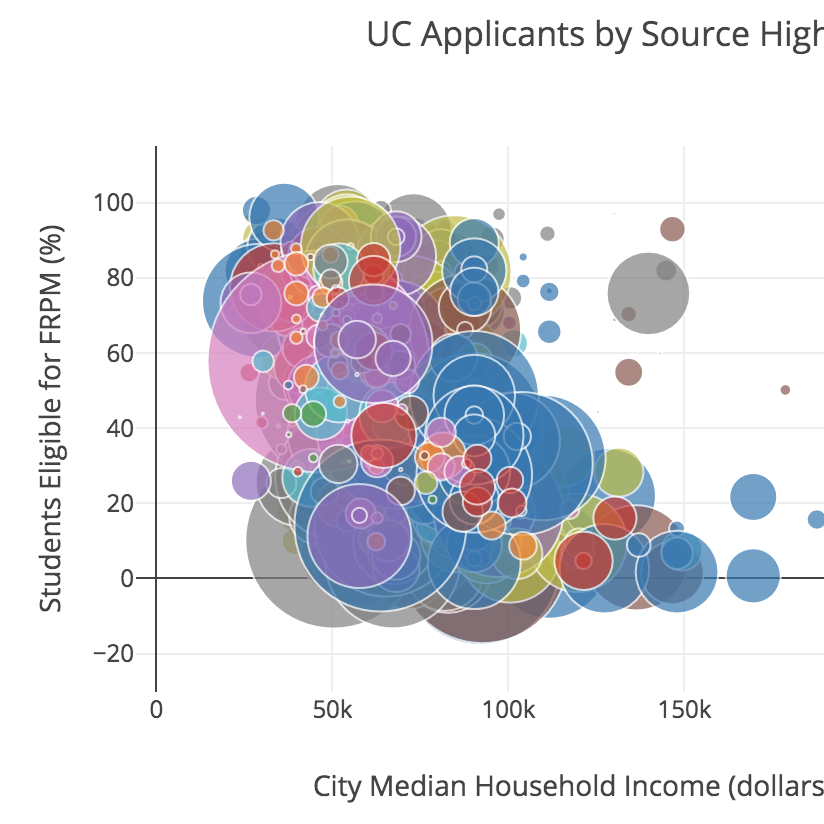
- UC Admissions Analysis